Perceptually Uniform Colormaps and Avoiding the Rainbow in Data Visualization and Scientific Imaging
Why rainbow colormaps mislead and how modern perceptually uniform alternatives improve accuracy and accessibility in science and data.
Few subjects in data visualization and scientific imaging have prompted as much evidence-based reform as the documented failures of rainbow (spectral) colormaps. The bright “jet,” “rainbow,” or “turbo” scales that were once ubiquitous defaults have been shown, in controlled studies and in real incidents, to distort magnitude perception, fabricate false boundaries, conceal important structure, and lead to systematically incorrect conclusions.
The established response is the adoption of perceptually uniform colormaps: scales constructed in perceptual color spaces so that equal steps in the underlying data produce approximately equal perceived steps for human observers. This article explains why the distinction matters, what constitutes a sound colormap, how to select the right type for the data, and how these principles apply in both public communication and high-stakes scientific and medical work.
Side-by-side demonstration of how classic rainbow colormaps introduce artificial banding and non-uniform perceptual steps (left) while uniform alternatives such as viridis maintain more accurate visual encoding of the data (right).
Related Educational Video:
A Better Default Colormap for Matplotlib (SciPy 2015 talk by Stéfan van der Walt & Nathaniel Smith) — The widely cited presentation that accelerated adoption of viridis and similar maps.
Why Rainbow Colormaps Systematically Mislead
Rainbow colormaps fail on several perceptual and cognitive grounds:
Non-uniform perceptual distance. In most spectral scales the rate of perceived change varies sharply across the hue range. Steps through the yellow-green region are often far more salient than equivalent increments in blue or red. Viewers unconsciously assign greater importance to some data ranges than others.
Artificial boundaries. Sharp hue transitions create the visual impression of edges or layers that do not exist in the data. This artifact has been shown to cause misidentification of features in fluid dynamics, medical imaging, climate data, and other domains.
Unreliable ordering. Although the physical spectrum is ordered, most viewers do not intuitively map “blue-green-yellow-red” onto “low-to-high” without training. Many people mentally reorder or ignore portions of the scale.
Failure for color vision deficiency. A substantial portion of common rainbow scales become nearly unusable or severely distorted for the roughly 8 % of men (and smaller but meaningful percentage of women) with red-green color vision deficiencies. The same data can appear almost flat or wildly varying depending on the observer.
Emotional and semantic loading. Saturated, bright segments of the scale are frequently interpreted as “important,” “hot,” or “extreme” regardless of the actual data values.
Peer-reviewed studies and practitioner reports, including work led by Fabio Crameri and others, have documented measurable errors in feature identification, value estimation, and decision-making traceable to rainbow scales. In scientific and medical contexts the consequences can be serious.
What Makes a Colormap Perceptually Uniform
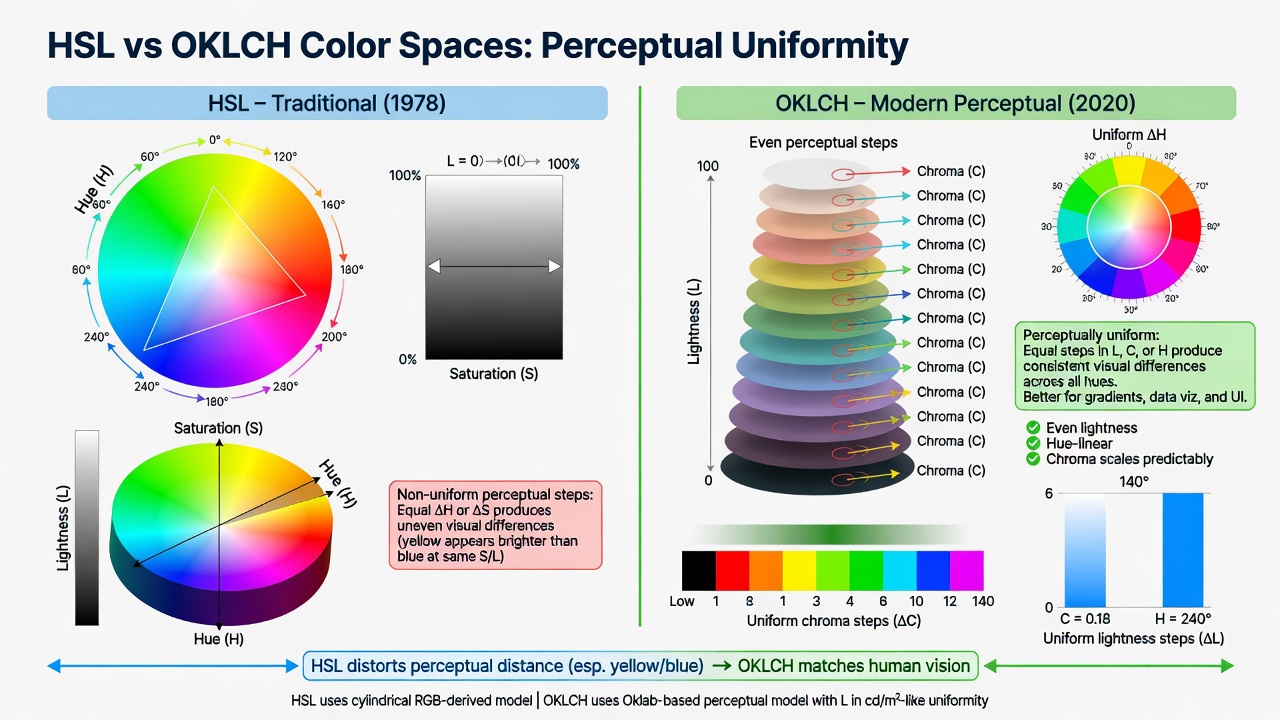
A perceptually uniform colormap is engineered so that equal increments in the data variable correspond to approximately equal increments in perceived lightness or color difference for typical human observers. This is usually achieved by working in a perceptually uniform color space (such as CIELAB or its derivatives) rather than in RGB or HSL.
Uniformity is not the same as attractiveness. Some of the most effective scientific colormaps are deliberately restrained so that the data, rather than the scale itself, remains the focus of attention. The goal is faithful visual encoding, not visual excitement.
Modern libraries provide families of uniform colormaps designed for different data types: sequential (ordered from low to high), diverging (symmetric around a meaningful midpoint), and qualitative/categorical (distinct colors with no inherent order). Choosing the wrong family for the data type is a common and consequential error.
Matching Colormap Type to Data Semantics
Sequential colormaps are appropriate for data with a clear low-to-high direction and no meaningful central value. Diverging colormaps are used when there is a critical midpoint (zero, an average, a threshold) and deviation in either direction is meaningful. Qualitative colormaps are for categorical data where the only requirement is clear distinction between groups.
Using a sequential map on diverging data, or a rainbow map on ordered data, introduces systematic distortion. The colormap should be chosen to match the semantics of the variable, not the aesthetic preference of the designer.
Practical Adoption and Common Pitfalls
Adoption has improved substantially since the mid-2010s, with major tools (matplotlib, MATLAB, Tableau, and others) now offering perceptually uniform options as defaults or strong recommendations. Nevertheless, rainbow scales persist in legacy code, published figures, and some domain-specific software.
Common remaining pitfalls include:
- Choosing a “pretty” colormap without checking its perceptual properties.
- Using the same map for both sequential and diverging data.
- Failing to test for color vision deficiency.
- Overriding a tool’s default with a non-uniform scale for aesthetic reasons without understanding the consequences.
Responsible practice includes documenting the colormap used, providing a color bar with clear units, and making the underlying data available so that others can re-visualize with different scales if needed.
Perceptually uniform colormaps are not a panacea. They are a necessary corrective to a long-standing source of systematic error in visual data communication. When combined with appropriate map type selection, accessible design, and clear labeling, they allow color to serve as a reliable carrier of quantitative information rather than an obstacle to accurate perception.
A perceptually uniform colormap is constructed so that the distance between adjacent colors in a uniform perceptual space (such as CAM02-UCS, OKLAB derivatives, or carefully calibrated CIELAB) remains roughly constant. Lightness often increases monotonically for sequential maps; this provides a reliable luminance cue even when hue is difficult to distinguish.
Designers also optimize for:
- CVD safety (colors remain distinguishable after common deficiency simulations).
- Printability and grayscale conversion (the scale should retain useful ordering when desaturated).
- Smooth interpolation without introducing false artifacts.
- Appropriate gamut usage for the target display or print medium.
The viridis family (viridis, plasma, inferno, magma, cividis) and Crameri’s scientific colour maps collection are prominent public examples of this approach. Tools such as ColorBrewer (originally for maps), colorcet, cmocean, and various scientific libraries now make high-quality uniform maps the easy default rather than an expert choice.
Choosing the Right Type for the Data
Matching colormap type to data semantics is as important as uniformity itself:
- Sequential: One-directional ordered data (temperature, population density, probability). Lightness or chroma increases steadily. Viridis and similar maps excel here.
- Diverging: Data with a meaningful central value (anomaly from mean, profit/loss, above/below threshold). The scale is symmetric around a neutral midpoint, usually a desaturated or mid-lightness color.
- Qualitative / Categorical: Unordered distinct classes. The requirement is separability rather than order; limit to 5–8 well-spaced hues and always combine with direct labels or patterns.
- Cyclic: Periodic quantities (direction, phase, time of day). The scale must join smoothly at the ends.
Using a sequential map for diverging data, or a rainbow for any quantitative scale, is a common and consequential error.
Applications and Risks in Scientific, Medical, and Public Communication
In research imaging (astronomy, microscopy, remote sensing, climate modeling) and medical visualization (MRI, CT, ultrasound overlays, dermatology, pathology), colormap choice directly affects what experts—and the public—perceive.
False-color representations in medical imaging, for example, are powerful diagnostic aids but can mislead when the colormap is non-uniform or when the mapping between color and physical quantity is not clearly annotated. Public health and climate visualizations have documented cases in which rainbow scales exaggerated or hid important thresholds.
Best practice in these domains now includes:
- Explicit colormap choice rationale in methods or figure captions.
- Accompanying color bars with clear numerical labels and units.
- Preference for uniform sequential or diverging maps over spectral defaults.
- Accessibility review of all published figures (CVD simulation + grayscale check).
The same principles apply to embedded product visualizations that display scientific or sensor data to non-expert users.
Tooling, Implementation, and Enforcement
Modern libraries and design systems make correct choices straightforward:
- Matplotlib, Plotly, Vega, D3, and most scientific Python/R/Julia ecosystems now default to or prominently feature uniform maps.
- Design tokens for data visualization can encode approved sequential, diverging, and categorical ramps generated in OKLCH.
- Linting and review processes (or automated checks in CI) can flag use of deprecated rainbow maps or missing color bars.
When embedding third-party visualization tools, teams should configure or post-process outputs to use the product’s approved uniform palettes.
Visual Comparisons and Tools:
- Classic comparison: A Better Default Colormap for Matplotlib (Viridis) (SciPy 2015, Stéfan van der Walt & Nathaniel Smith) — side-by-side jet vs. viridis.
- Articles with charts: “Why use colormap viridis over jet?” (Cross Validated/StackExchange discussions with plots); “Color in a Perceptual Uniform Way” (Nightingale DVS) with before/after.
- Tool: fixthejet Python package to convert jet images to uniform colormaps.
- Wikimedia Commons: Search “viridis colormap” or “jet colormap comparison” for CC-licensed diagrams (attribute appropriately; project has local
viridis-vs-jet-colormap.jpgfor reference).
Actionable Guidance
For teams producing or consuming data visualizations:
- Audit existing figures and dashboards for rainbow or non-uniform scales; replace them.
- Choose or generate colormaps using perceptual uniformity as a hard requirement, then verify with CVD and grayscale simulation.
- Always provide a labeled color bar or direct annotations; never assume the scale is self-evident.
- Document the colormap and its rationale alongside the visualization.
- Test interpretation accuracy with representative users, including those with color vision differences.
- In medical, scientific, or policy contexts, treat colormap selection with the same seriousness as statistical methods or measurement calibration.
Reflection questions:
- If a viewer converts your visualization to grayscale, does the data ordering and feature saliency remain intact?
- Would someone with deuteranopia extract the same insights from the figure as someone with typical color vision?
- Is the colormap choice explained, or is it simply the tool default?
- Does the visualization use color to represent magnitude honestly, or does it create visual emphasis that the numbers do not support?
Perceptually uniform colormaps are not merely an aesthetic upgrade. They are a basic requirement for honest visual communication of quantitative information. In an era when data visualizations reach both expert and public audiences at unprecedented scale, choosing and enforcing them is one of the simplest, highest-leverage improvements any team or publication can make.
References & Sources
- 1.Fabio Crameri et al. Navigating color integrity in data visualization (Nature Communications, 2024) and The misuse of colour in science communication (2020).
- 2.Stéfan van der Walt & Nathaniel Smith. Viridis colormap and perceptual uniformity (SciPy 2015 and subsequent matplotlib work).
- 3.Cynthia Brewer (ColorBrewer), Kenneth Moreland, and subsequent scientific colormap research.
- 4.Modern tooling: Colorcet, cmocean, cmcrameri, and related perceptually uniform libraries.
All claims in this article were verified against primary or authoritative sources during line-by-line fact-checking.