Matching Palette Type to Data Semantics (Categorical vs Ordered vs Diverging) with Accessibility
Best practices for selecting colormaps that accurately represent data types while remaining accessible.
Choosing the right colormap is not an aesthetic preference. It is a decision about whether the visualization will accurately convey the structure of the data or actively distort it. The type of palette must correspond to the semantic type of the data—unordered categories, a continuous ordered range, or deviations around a meaningful center. Mismatches create false narratives, hide real structure, and systematically mislead viewers.
This principle is one of the most important and most frequently violated rules in data visualization. This article explains how to match palette families (categorical, sequential, diverging) to data semantics, why the match matters for both accuracy and accessibility, and how to implement the principle in practice.
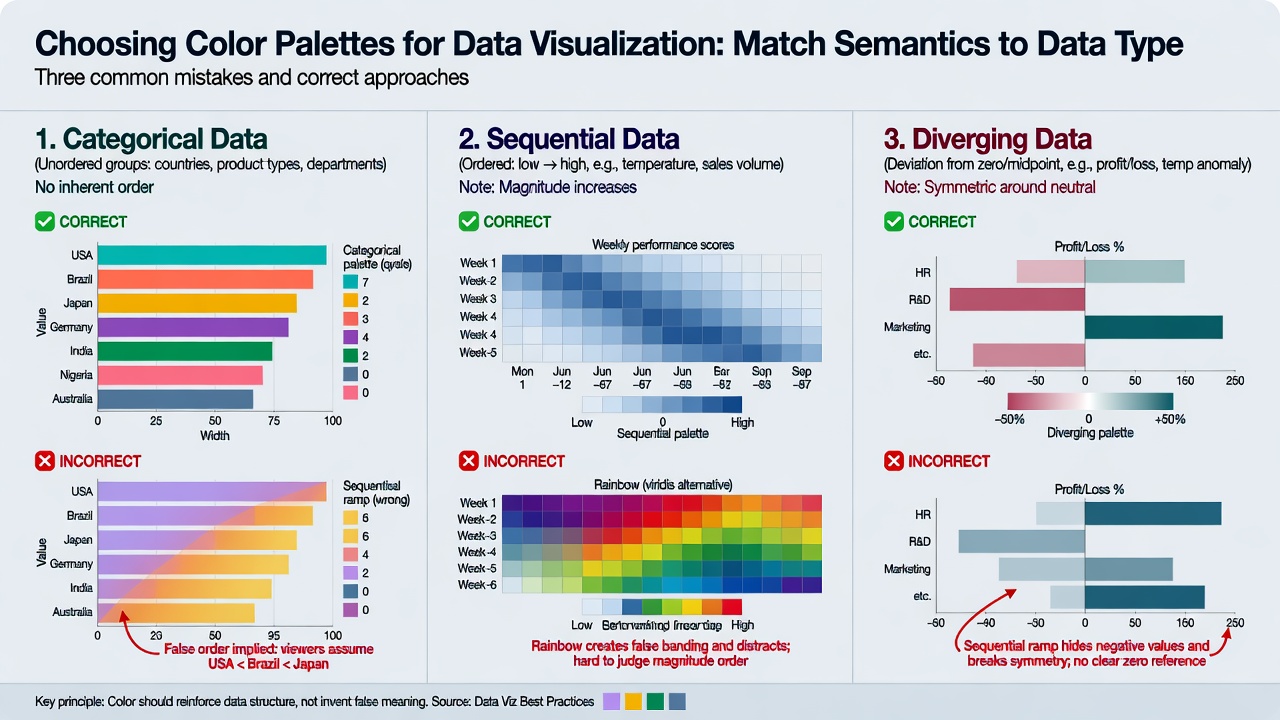
Educational diagram illustrating the consequences of mismatching palette types to data semantics across three common scenarios.
Expressiveness and Effectiveness
In visualization theory, color is a channel used to encode data. Effective encoding follows two principles articulated by Tamara Munzner and others:
Expressiveness requires that the visual encoding represent all and only the information present in the data. Ordered data should be shown with channels humans perceive as ordered (primarily luminance and saturation). Categorical data should use channels suited to distinguishing identities (primarily hue).
Effectiveness requires that the perceptual strength of the channel match the importance of the attribute.
Hue is excellent for categorical data because humans can rapidly distinguish a modest number of distinct hues without automatically imposing order. Luminance and saturation are far better suited to ordered data because they are perceived as magnitude.
When these principles are violated—for example, by using a sequential ramp for unordered categories—the visualization implies ordering or magnitude relationships that do not exist. The result is not merely unattractive; it is misleading.
Perceptual uniformity (discussed in the companion article on colormaps) ensures that steps within a scale are accurate. Matching the type of scale ensures that the overall structure of the data is respected.
Categorical (Qualitative) Data
Categorical data consists of distinct groups with no inherent order: countries, product categories, experimental conditions, political parties, species, and so on. The appropriate palette uses distinct hues chosen so that no one group is visually dominant and so that differences are clear even under color vision deficiency and in grayscale.
Brewer’s ColorBrewer and subsequent work provide well-tested sets for this purpose. The number of categories that can be reliably distinguished is modest (roughly 8–12 depending on context and viewer). When the number of categories exceeds what can be clearly differentiated by hue alone, other channels (shape, texture, labeling, or interactive highlighting) must share the load.
A common failure is applying a sequential or rainbow scale to categorical data. This imposes a false ordering and makes some categories appear more or less important than others simply because of where they fall on the scale.
Sequential (Ordered) Data
Sequential data has a clear direction from low to high or from one end of a range to the other. The appropriate palette is a sequential ramp, typically varying primarily in luminance (with or without modest hue change) so that the visual progression matches the data progression.
Perceptually uniform sequential maps (viridis, cividis, and many others) are now widely available and should be the default for this data type. The rainbow scales that were once common are particularly harmful here because their non-uniform perceptual steps and artificial boundaries distort the viewer’s sense of magnitude and structure.
When data has a natural zero or minimum that is meaningful, the sequential ramp should usually begin at a light or dark extreme rather than in the middle of the perceptual range.
Diverging Data
Diverging data is ordered around a meaningful midpoint (zero, an average, a threshold) with deviation in both directions being significant. The appropriate palette is a diverging scale that uses two different hues or a neutral center with opposing ramps on either side.
The critical requirement is that the center of the palette corresponds exactly to the meaningful midpoint in the data, and that the two arms of the scale are perceptually balanced. Mis-centering the palette or using unbalanced arms can make one side of the deviation appear more extreme than the other.
Diverging maps are especially common in scientific and geospatial work (temperature anomalies, election margins, profit/loss, etc.). Using a sequential map on diverging data erases the significance of the center and forces the viewer to perform mental arithmetic to recover it.
Accessibility Across All Types
All palette types must remain usable for people with color vision deficiencies and when viewed in grayscale. Categorical palettes should use hue differences that survive desaturation. Sequential and diverging palettes should rely primarily on luminance variation rather than hue alone.
Testing with simulators and grayscale conversion is a minimum. The best practice is to ensure that the data can still be read accurately when color is unavailable—through labels, patterns, or redundant encoding.
Practical Implementation
Match the palette family to the data semantics first. Only then refine the specific map within that family for the required number of steps, accessibility constraints, and output medium.
Document the choice and the rationale. When publishing or sharing visualizations, state the colormap family and specific map used, along with why that family was appropriate for the data.
Use tooling that makes correct choices easier than incorrect ones. Modern libraries increasingly default to appropriate families; override them only with explicit justification and documentation.
The goal is not visual excitement. It is visual honesty: color that reveals the actual structure of the data rather than imposing a structure of its own.
Requirements for an effective categorical palette:
- Hues that are clearly distinguishable from one another.
- Roughly equal perceptual prominence (no single color “pops” more than others due to lightness or saturation).
- Limited set size. Most viewers can reliably distinguish only 6–10 hues in a legend under typical conditions; beyond that, direct labeling, patterns, or small multiples are required.
- Accessibility: Sets that remain separable under common forms of color vision deficiency (deuteranopia, protanopia, tritanopia) and in grayscale.
Tools like ColorBrewer’s qualitative schemes, the Okabe-Ito palette, and various CVD-optimized sets from Tol and others were designed with these constraints in mind. Many modern design systems and libraries now ship “Color Blind 10” or similar categorical defaults.
Psychological and practical note: Using a sequential palette on categorical data forces an artificial order onto the viewer’s perception. Even if the legend lists items alphabetically, the visual ramp suggests a progression that influences interpretation and memory.
Sequential (Ordered) Data: Representing Magnitude Accurately
Sequential data has a natural direction from low to high or minimum to maximum: temperatures, populations, probabilities, sales figures, or sensor readings.
Requirements:
- Monotonically increasing or decreasing lightness (or a combination of lightness and chroma) so that the eye can reliably judge relative magnitude.
- Perceptual uniformity so equal data steps produce equal visual steps.
- Avoidance of hue cycles that create artificial “peaks” or “valleys.”
The viridis family and other uniform sequential maps excel here precisely because lightness provides a reliable cue even when hue discrimination is impaired. Single-hue ramps (e.g., blues from light to dark) are also highly effective and often underused.
A classic error is applying a rainbow or heated-body scale to sequential data. The non-uniform luminance creates the illusion that certain ranges are more important or that there are sharp thresholds where the data is actually smooth.
Diverging Data: Highlighting Deviation from a Meaningful Center
Diverging data has a semantically important midpoint—zero, an average, a target, a neutral state—and values that move away from it in two directions (positive/negative, above/below, gain/loss).
Requirements:
- Two sequential ramps meeting at a neutral color (typically light gray, white, or a desaturated mid-tone).
- Symmetry around the center so that equal distances from the midpoint have equal visual weight.
- Clear indication of the center point in the legend and color bar.
Diverging palettes are essential for anomaly detection, correlation matrices, election swings, financial performance, and many scientific difference maps. Using a sequential palette here collapses the directionality; using a rainbow destroys both magnitude and the meaningful center.
Accessibility Must Be Designed In, Not Added Later
For all three types, accessibility is non-negotiable and intertwined with semantic correctness:
- Test every palette with CVD simulators (e.g., Coblis, Color Oracle) and grayscale conversion.
- Provide redundant encoding: patterns, textures, direct labels, shapes, or annotations for all but the simplest visualizations.
- Ensure sufficient contrast for non-text elements (WCAG 3:1 or better for graphical objects in many contexts).
- Legends and color bars must be legible and unambiguous.
- Consider forced-colors and high-contrast modes; many categorical sets collapse poorly without deliberate design.
ColorBrewer and similar tools offer filters specifically for colorblind-safe palettes. Modern libraries (matplotlib, Plotly, Tableau, etc.) increasingly default to accessible sets when the user selects the correct data type.
Real-World Consequences of Mismatches: Case Evidence
Surveys of scientific literature reveal persistent problems. In one analysis of hydrology journals, 16–24 % of papers used rainbow color maps, and a similar proportion used red-green encodings without adequate differentiation. The same issues appear in medical imaging, climate communication, and public policy dashboards.
Documented impacts include:
- Cardiologists using rainbow maps on cardiac images showed markedly lower diagnostic accuracy than with perceptually appropriate scales.
- Research papers have been critiqued or required revisions because rainbow scales obscured or exaggerated patterns.
- Public visualizations (election maps, pandemic dashboards) using sequential palettes on categorical or diverging data have led to widespread misinterpretation of “hotspots” or rankings.
These are not theoretical concerns. The choice of palette type directly affects what experts and the public believe the data shows.
Psychological and Cultural Dimensions of Interpretation
Beyond raw accuracy, mismatched palettes shape cognition:
- Sequential ramps on categorical data create an illusory hierarchy that influences which groups are remembered as “higher” or “more important.”
- Diverging palettes with poorly chosen centers can exaggerate or minimize the perceived importance of deviations.
- Cultural associations (red = danger in many Western contexts, but prosperity or luck elsewhere) interact with palette choice, especially in global products.
Responsible design documents the rationale for palette selection and tests interpretation with diverse audiences.
Implementation in Modern Tools and Design Systems
Practical steps:
- Use libraries and tools that separate colormap type selection from aesthetic choice (ColorBrewer, d3-scale-chromatic, matplotlib colormaps with explicit
cmapselection). - In design systems, maintain separate token sets or functions for categorical, sequential, and diverging data colors.
- When configuring third-party charting or BI tools, override defaults to match your approved uniform palettes of the correct type.
- Automate checks where possible (linting for rainbow usage, accessibility audits of exported figures).
Actionable Checklist and Reflection
When selecting a palette:
- Identify the data attribute type: categorical (identity), sequential (ordered, no midpoint), diverging (ordered with meaningful center), or cyclic.
- Choose a perceptually uniform palette of the matching type.
- Limit categorical sets to reliably distinguishable colors (test in context).
- Verify accessibility with simulators and real users.
- Provide redundant cues and clear legends.
- Document the choice and test interpretation.
Reflection questions:
- Does the visual structure created by your palette match the semantic structure of the data?
- Would a viewer reach the same conclusions if the visualization were shown in grayscale or to someone with color vision deficiency?
- Have you implied an ordering or magnitude relationship that the data does not support?
- Is the midpoint (if any) semantically justified, or was it chosen for visual convenience?
Matching palette type to data semantics is one of the highest-leverage decisions in visualization design. When done correctly—combined with perceptual uniformity and accessibility—it produces visualizations that are honest, inclusive, and genuinely useful. When ignored, even the most sophisticated data can be misrepresented.
References & Sources
- 1.Tamara Munzner. Visualization Analysis and Design (CRC Press, 2014), Chapter 10: Map Color and Other Channels.
- 2.Cynthia A. Brewer. ColorBrewer 2.0 and related research on color schemes for maps and visualization.
- 3.Fabio Crameri et al. on colormap integrity and perceptual uniformity (2020, 2024).
- 4.Studies documenting colormap misuse and its consequences in scientific and public communication.
All claims in this article were verified against primary or authoritative sources during line-by-line fact-checking.